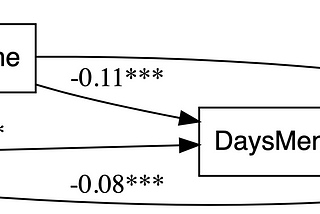
Understanding path analysis: paths, standardized coefficients and causalityPath analysis is part of the family of structural equation modeling (SEM) techniques, but it focuses solely on observed variables (not…Feb 8Feb 8
Using fuzzy joins in R: handling unmatched stringsData often comes with inconsistencies, especially when dealing with real-world datasets. Variations in spellings, typos, or differing…Jan 25Jan 25
Understanding descriptive analysis for epidemiological researchDescriptive analysis is a key component of epidemiological research. This is the first step in all population survey data analysis that…Nov 27, 2024Nov 27, 2024
Superheat plots: avisual tool for exploring relationships in RThe superheat package creates a heat plot or heatmap which isuseful for exploring relationships among the variables by a target variable in…Oct 10, 2024Oct 10, 2024
Guide to spatial analysis in R: using global GDP distribution data from World BankIn this post, we will explore how to analyze the distribution of Gross Domestic Product (GDP) across countries using spatial analysis…Oct 2, 2024Oct 2, 2024
Estimating predicted probabilities in StataIn statistical analysis, particularly with logistic regression models, understanding and interpreting the predicted probabilities can…Jul 31, 2024Jul 31, 2024
What are Lists in R?At its core, a list in R is a ordered collection of objects. These objects can be of any type — vectors, matrices, data frames, functions…Jul 29, 2024Jul 29, 2024
Creating a published trend chart using the rentrez package in RFor research enthusiasts, understanding publication trends of different topics in major databases, e.g., PubMed, can be a vital tool. In…Jul 28, 2024Jul 28, 2024
One-Sample Z-Test for the Mean vs. Two-Sample Z-TestIn statistical hypothesis testing, researchers often need to compare data samples to make inferences about population parameters. Two…Jul 13, 2024Jul 13, 2024